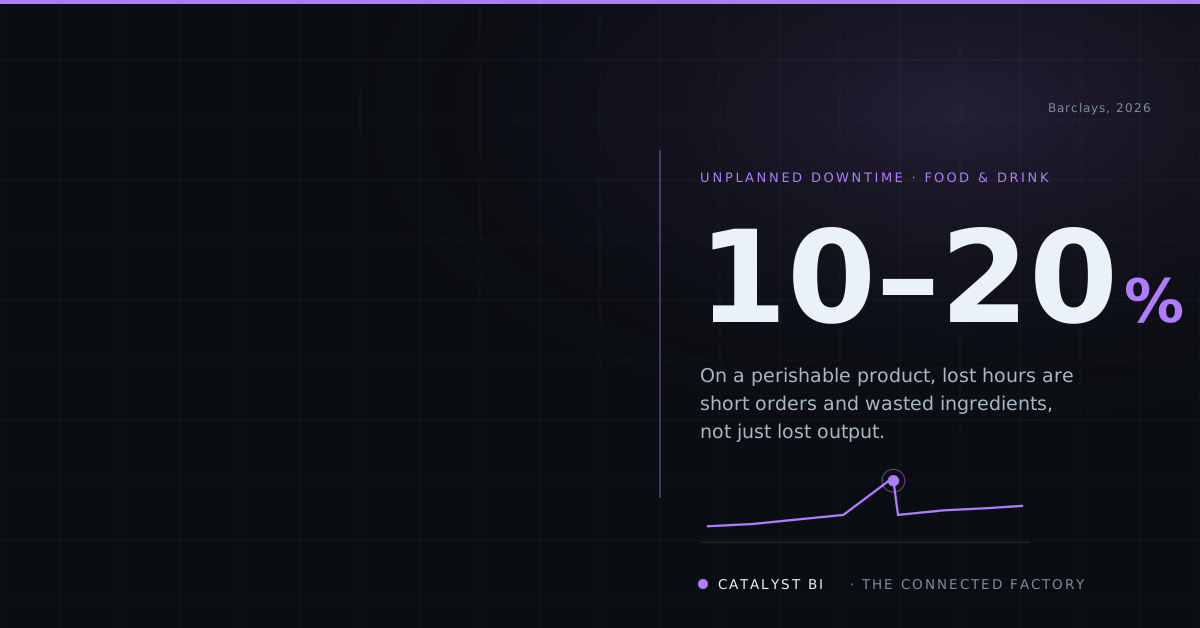
Food and drink lines lose 10 to 20 per cent of production time to unplanned downtime. The line usually knew. Here is how connecting your data lets you see it coming and protect margin.
On a perishable product, lost hours are short orders and wasted ingredients, not just lost output. (Barclays, 2026)
Ask a food or drink manufacturer whether they use AI and the answer is usually yes. Ask where, and it is almost never on the line. It is in the back office, in forecasting spreadsheets, in a pilot someone ran once. The place where you actually make the product, the part that makes you a manufacturer, is the part AI still cannot see.
That gap has a cost, and in food and drink it shows up first as downtime. In a typical year, 71 per cent of food and beverage manufacturers lose between 10 and 20 per cent of their production time to unplanned stoppages (Barclays, 2026). On a perishable product with a fixed shelf life and a retailer waiting, lost hours are not just lost output. They are short orders, wasted ingredients and overtime to catch up.
Why does the line stop without warning?
Because the signals that would have warned you are trapped in the machine that produced them. A drifting motor, a bearing running hot, a filler losing pressure, a fridge cycling harder than it should: each of these shows up in sensor data long before it becomes a breakdown. The trouble is that the data sits in a historian or a PLC, in that plant's own naming, and it never meets the production order, the batch or the shift it belongs to. So nobody can join “this asset is degrading” to “this is what we were running when it happened”.
The result is maintenance that is either reactive, waiting for the failure, or calendar-based, servicing things that were fine. Both waste money. Neither uses what the line already knows.
Isn't this just a maintenance problem?
No, and treating it as one is why so many predictive maintenance pilots stall. A model built on one plant's tags and one plant's definition of a stoppage does not travel to the next site, because the next site names everything differently. The model was never the hard part. Connecting and standardising the data underneath it was.
Get that foundation right and the return is real. In Barclays' research, 70 per cent of food and drink manufacturers believe AI-based predictive maintenance can cut unplanned downtime by 10 to 25 per cent, and 94 per cent expect a positive return within three years (Barclays, 2026).
Why does the same fix protect margin everywhere else?
Because the data foundation that lets you predict a stoppage is the same one that sharpens forecasting and cuts waste. Once machine, production and cost data are joined and trusted, the same platform can tell you which products are quietly unprofitable once real energy and downtime are counted, where a demand forecast is about to leave you with short-dated stock, and which line is carrying the waste. In Barclays' survey, 70 per cent of manufacturers expect AI-driven planning to improve cash-flow forecasting and 64 per cent expect it to reduce total inventory. That is working capital released, not just a better report.
The honest barrier is not ambition. It is that only 1 per cent of food and drink manufacturers say they use the operational data they already collect very effectively (Barclays, 2026). The data is there. Using it is the gap.
What does “connected” actually mean on a food and drink site?
None of that requires ripping out your existing systems. Retrofit sensors and edge devices can pull data from older lines without interrupting production, and a modern data platform can bring it together and serve it back to the people on the floor in plain language. The tools depend on your environment, not a vendor preference; we build this across the modern data stack and choose what fits the data you already hold. In practice that is often Fivetran or Talend pulling sensor, production and ERP data into Snowflake or Databricks, modelled with dbt, with the predictive model built in Qlik AutoML and the result served on the floor in Qlik.
Where should you start?
Not with a new pilot. Start with one line where downtime already hurts. Connect its machine, maintenance and production data for a single quarter. Put one predictive maintenance model into production on it. Then reuse the same standard and governance on the next line, rather than starting again. That keeps the first step small enough to deliver and sound enough to scale, and it gives the board something most AI programmes never produce: a use case running on the floor, with a number attached.
Your line already knows it is about to stop. Connecting the data is how you get to know it too, in time to do something about it.
Score your own line in two minutes.
Ten questions, a score out of ten, and a sense of how your operation compares with the sector, which averages around six.