OTIF is where production, planning and logistics data have to agree, and usually don't. This article shows how connecting the data turns a lagging service score into something you can steer during the week.
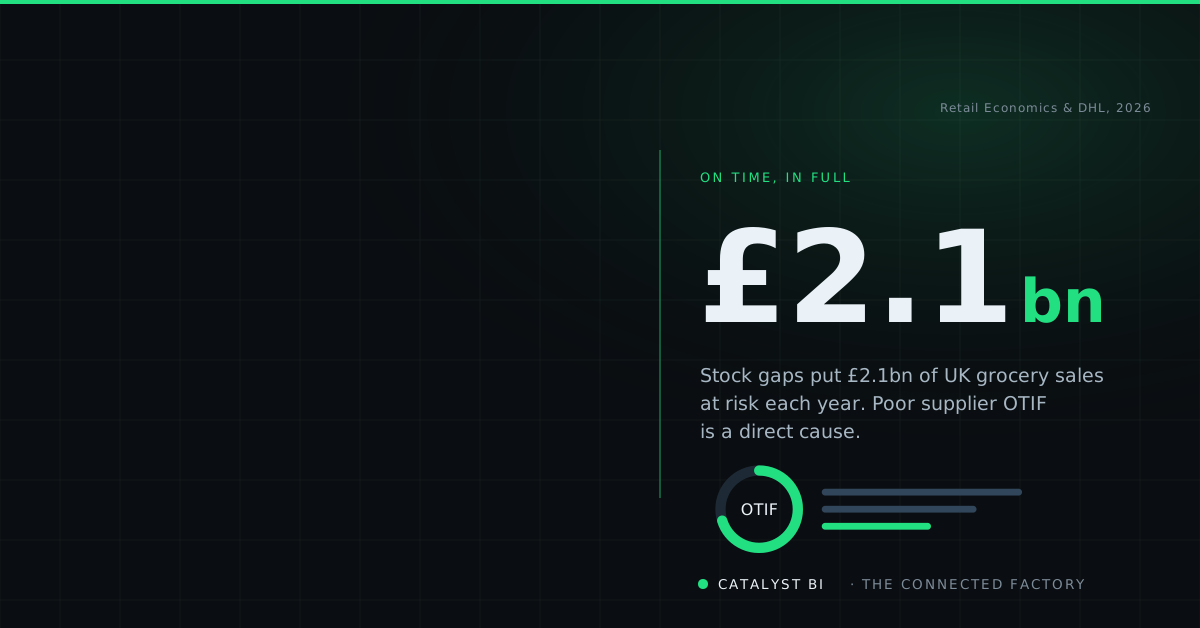
Stock gaps put £2.1 billion of UK grocery sales at risk each year. Poor supplier OTIF is a direct cause. (Retail Economics & DHL, 2026)
OTIF is the number your customer actually feels. You can hit the production plan, clear the line and still ship an order late or short, because on-time-in-full is decided across three systems that rarely tell the same story: what production made, what planning promised, and what logistics moved.
For a Supply Chain Lead, a falling OTIF score is the symptom everyone can see and no one can fully explain. For an Operations Director, it is the gap between a good production week and an unhappy customer. The score usually arrives at month-end, long after the week that caused it, so by the time you can read it the order is already late.
Why does OTIF slip even when production hits target?
Because on-time-in-full is a cross-system measure, and the systems that decide it were never built to agree. Each one is accurate about its own part of the job and blind to the rest:
Each system is right on its own. None of them, alone, can tell you whether the customer got what they were promised, when they were promised it. Worse, on-time and in-full are often defined differently in each system and by each customer, so when a delivery misses, the argument about whose fault it was can take longer than the fix. The data to settle it exists. It is just never in one place at one time.
What does a connected OTIF view show you?
Once those systems are joined on one platform, OTIF stops being a score and becomes a signal. Take a single miss. The short you booked on Friday was not one problem. It was a late changeover on line 2 on Tuesday, a component stock-out on Wednesday, and a carrier that collected after cut-off on Thursday. Three systems each logged their piece. None of them joined the three into a single sentence: this is why the order shipped short. A connected view does.
With the data joined, you can read promised against delivered at order and line-item level rather than as a site average, attribute every miss to its real cause across production, stock and transport, and watch the number building during the week while there is still time to expedite, re-plan or warn the customer. That shift, from a lagging report to a live signal, is what lets a supply chain team act on OTIF instead of apologising for it.
What is the number worth?
That is the size of the prize sitting on the shelf, and a slice of it is yours to lose every time you ship short. Every UK grocery supplier is measured on a service-level scorecard, and a miss on on-time or in-full costs quickly: deductions on the shortfall, the expedite and overtime to recover the order, and the working capital tied up in safety stock you only hold because service is unpredictable. The clearest published example of how hard retailers charge for this is Walmart, which fines suppliers 3 per cent of the cost of goods on deliveries that miss its threshold.
The bigger cost is the one that never shows on an invoice. Sustained poor OTIF costs range. Retailers reward reliable suppliers with listings and move unreliable ones down the range or out of it, and winning a delisted line back is far harder than keeping it. A service score you can only read once the month has closed is a commercial risk you cannot manage.
Where should you start?
Not with a service-improvement programme across every customer at once. Start where the pain is already felt, and prove the model there.
The right tools depend on your environment, not a vendor preference. We build this across the modern data stack and choose what fits the data you already hold and the skills in your team. For OTIF, that often means Fivetran or Talend to pull MES, the ERP order book, WMS and carrier data together, Snowflake or Databricks to model it, and Qlik to serve the live view, so your supply chain team ends up with a connected OTIF view they actually use, not another dashboard nobody trusts.
OTIF is not really a logistics metric. It is the score three disconnected systems give you for how well they agree. Connect them, and you can steer service during the week instead of reading about it once the month has closed.
How connected is your operation?
Ten questions, a score out of ten. See where the gaps between production, planning and logistics are costing you service.