


The Qlik Sense September 2020 release contains many new and exciting features with a focus on Insight Advisor and other Augmented Intelligence features. These additions help experienced and novice users alike to speed up creation and find answers easier. Below we’ll take a look at each of the new features further!
Insight Advisor Chat
Insight Advisor has been continuously improving in Qlik Sense Enterprise since its introduction in June 2018, and now the September 2020 release brings Insight Advisor Chat to Qlik SaaS.
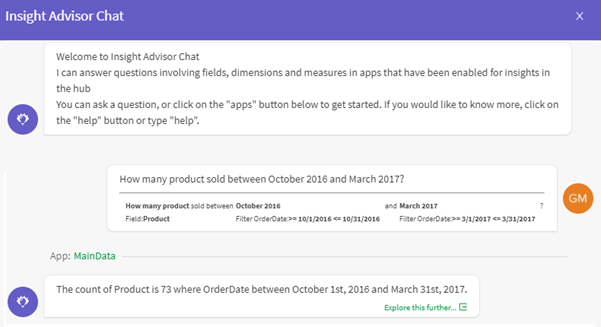
Available from the hub in Qlik SaaS, Insight Advisor Chat provides auto-generation of charts, narratives and observations from Natural Language processing, for instance you may ask it questions of the form:
How many products sold between 1st March and 30th June 2020?
How many customers purchased sportwear this year?
And it will return a natural language based answer (and sometimes a chart) while at the same time being quite clear about what it has done:
You can access it from the Ask Insight Advisor button at the top of the hub:
![]()
New Business Logic Features
As great as the Insights feature in Qlik is, sometimes it will repeatedly generate visualisations from a particular field in a way that is contrary to how you and your business typically want to use it.
For instance, when Qlik recognises a city or country field, Insights will often try to visualise this as a map. If you’d rather it didn’t do this, you can use the new Business Logic interface to change the fields’ data classification from city/country to a ‘normal’ dimension.
If you have both an order date and an invoice date in your data, you can set the invoice date to be the default calendar, so that when you search “Number of Customers This Month” in the lookup, Insights will generate its chart suggestions based on customers that have been invoiced this month.
Essentially, this is a tool to help Insights give you more relevant results, including the ability to change the default aggregation of a measure from sum to average, and the ability to inform Qlik that a certain list of dimensions are related.
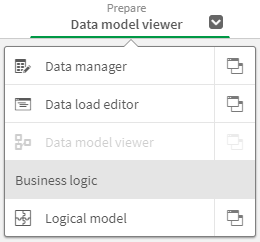
Look for the Business Logic feature in the Prepare dropdown in Qlik SaaS:
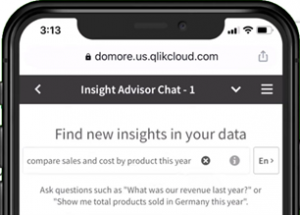
Search-based visual analysis on mobile devices
Search-based visual analysis generation is now available on handheld mobile devices when using the Qlik Sense browser interface. This allows for the creation and search of analytics on small form factors, rather than having to use traditional chart authoring.
Advanced analytics calculation – K-means clustering
For some time, the Qlik Sense Engine has been able to integrate with 3rd party Advanced Analytic engines (notably R and Python) but now Qlik has started to include machine-learning like algorithms within the default Qlik Sense engine library.
To begin with, Qlik has provided 4 K-means functions to be used for clustering and partitioning data by quantitative values (so by ‘measures’ rather than by ‘dimensions’).
Here is a simple example of the new KMeans2d function with the number of clusters set to 3:
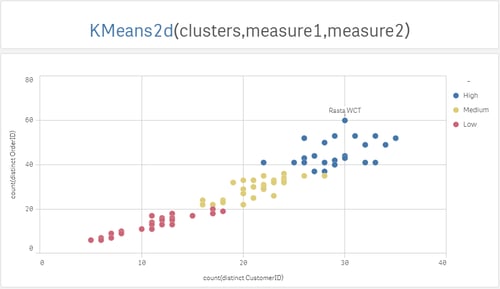
The other K-means functions included are KMeansCentroid2d (which could be used to give the centre-points of each of the 3 clusters in the above chart), KMeansNd and KMeansCentroidNd.
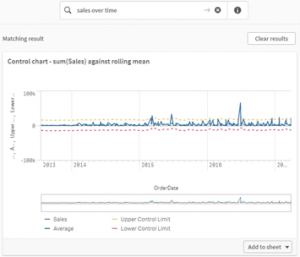
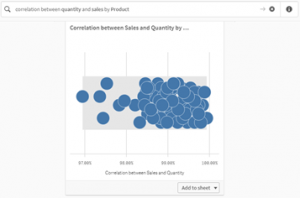
New search-based visual analysis chart types
Taking advantage of the new K-means clustering functions, Qlik has added 3 new chart types to Insight Advisor: Cluster Chart, Correlation Chart and Control Chart.
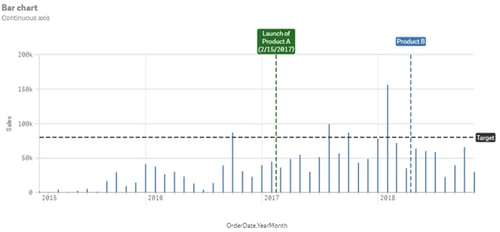
Improved reference lines
Line and bar charts now allow vertical reference lines based on a dimension with formatted labels. This can be useful for adding notable events to a time axis, such as the beginning and end of a marketing campaign to look for a noticeable effect on sales.
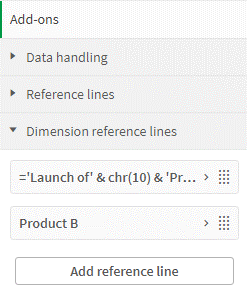
Reference line options available include:
- Specify a label text
- Show/hide values
- Show/hide condition
- Dashed or solid
- Coloured background
You can find them in the Add-ons section of a chart’s properties.
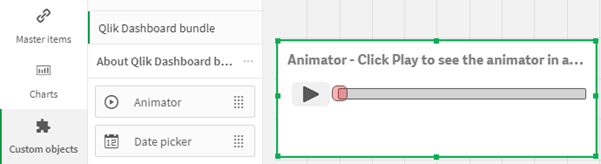
Animator control
This gives users the ability to animate changing data over time by auto-selecting values in any dimension (e.g. order date) and playing them once or in a loop, with or without accumulation.
- Makes auto selections
- Choose dimension to animate along (will typically be a time-based field)
- Accumulate or not
- Loop or not
- Choose speed of animation
Animator can be found in Custom Objects under the Qlik Dashboard bundle:
Further chart improvements
- Number of formatting of master measures
- Show/hide borders in containers
- Customer sorting of Sankey Chart
- Frequency counts in filter panes
- Show/hide hover icons that appear over charts
- Web map service layer opacity
Self-service hub improvements
In addition to the List View and Grid View of the apps available in the hub, there is now a Table View which can be accessed using Ctrl+g or by clicking on the icon shown here in the top right:
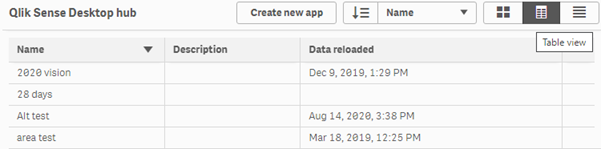
- This has columns for name, description, owner, published (if published), data last reloaded (if reloaded), detail.
- Sort by any of the above columns by clicking on the header
Qlik Sense SaaS Improvements
Some welcome improvements in this area enabling you to gain insight from more data, more often:
- With Immediate effect, the in-memory app size limit for Qlik Sense Enterprise SaaS is now 5GB.
- All limits on concurrent reloads, total daily reloads and total storage have been removed for Qlik Sense Enterprise SaaS and Qlik Sense Business.
Upgrading to Qlik Sense September 2020
If you are a Catalyst Cloud customer, we will take care of your upgrade over the coming weeks. Please contact your Account Manager for further upgrade options.
More on this latest release…
What’s New Qlik Data Analytics – September 2020: